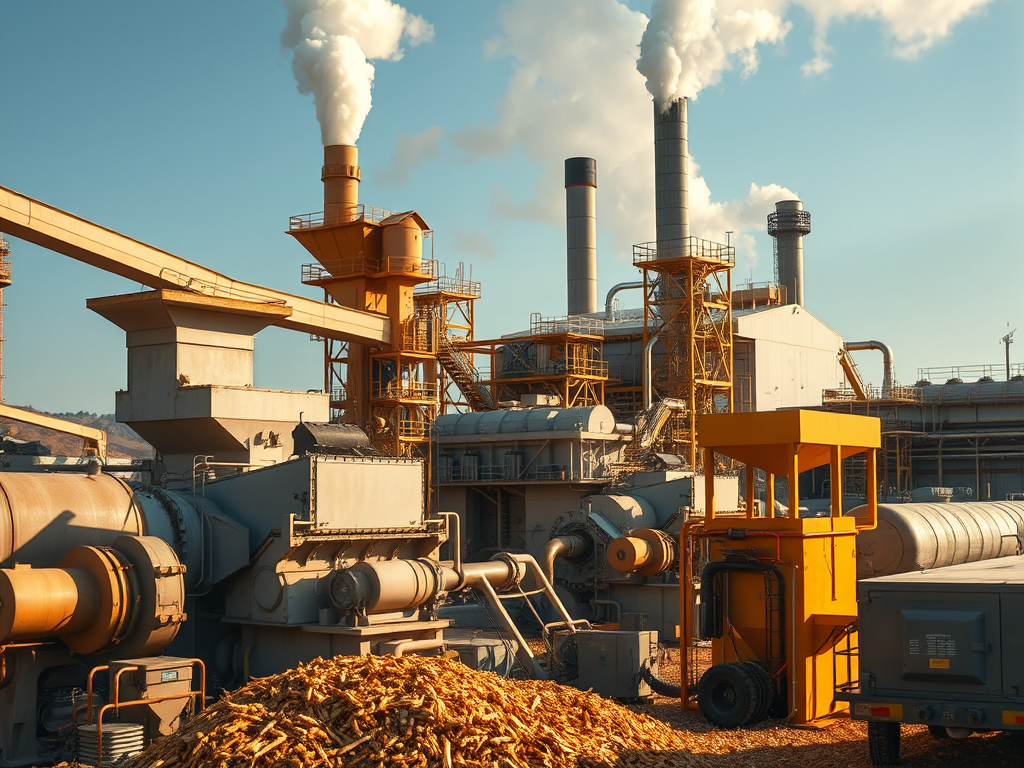
Back in 2008, I got the chance to work on something completely different from what I had done before. A large sugar and ethanol plant in Brazil. Not automotive. Not steel. Not pharma.
This was sugar cane coming in straight from the fields, being crushed and processed into sugar and ethanol, while energy cogeneration ran alongside everything. It was a plant that operated like a living organism during harvest season. And it taught me a lot of “modern IIoT lessons” years before we started using terms like IIoT, cloud platforms, or Unified Namespace.
At the time, nobody was calling this an IIoT project. It was just an industrial integration project, with dashboards, production tracking, quality integration, and ERP connectivity. But looking back, the DNA is exactly the same as what we’re still doing today.
The platform used for the solution was SAP MII. It sat in the middle between the plant floor systems and SAP ERP, turning raw operational signals into information the business could act on.
Why a Sugar and Ethanol Plant Hits Different
Most people picture manufacturing as either:
- Discrete parts moving down a production line, or
- Batch processes running in reactors
This plant was neither of those, at least not cleanly.
Sugar and ethanol production is process manufacturing with an agricultural input, and that changes everything.
Every load of sugar cane is different:
- Moisture content changes constantly
- Sugar concentration varies by field and weather
- Fiber content impacts extraction efficiency
- Timing matters because cane starts degrading fast after harvest
So you don’t get to assume stable yields or predictable performance. The “raw material variability” is baked into the operation. And the operating model was intense.
The sugar mill followed the harvest cycle. During harvest season, the plant ran 24/7 for roughly 6 to 8 months. Then it shut down completely for maintenance.
That creates a very specific kind of pressure: you basically have one shot to get it right. If the system fails during harvest, money is lost every minute. Real-time visibility wasn’t a nice-to-have. It was survival.
Another detail most people don’t realize: once sugar cane is cut, the clock starts. You have something like 36 hours before sugar content drops significantly. So the entire chain, from field logistics to crushing to processing, runs on tight timing.
That urgency shaped the whole solution, and it shaped the mindset of the people running the plant.
This Plant Was Making Three Products, Not One
The plant produced three major outputs:
- Sugar
- Ethanol
- Electricity
Yes, electricity.
They burned bagasse, the leftover fiber after crushing the cane, to generate steam and electricity. And excess power was sold back to the grid. That part was wild when I first saw it.
The plant wasn’t just making product. It was making its own power and selling energy as a revenue stream. The cogeneration unit was basically a separate business inside the plant, with its own performance targets and optimization goals.
So we weren’t building “a dashboard for production.”
We were connecting agricultural inputs, continuous production, quality lab results, and energy operations, then feeding the right pieces into SAP ERP in a way that could actually be trusted.
The Real Job Was Integration, Not Screens
SAP ERP handled the business side:
- planning
- inventory
- financials
- reporting
- official records
But the real action was on the plant floor.
The solution needed a layer in the middle that could:
- pull data from controllers and plant systems
- normalize and contextualize it
- calculate useful metrics
- publish it in near real time
- support both operations and the business side
That’s where SAP MII played its role. The biggest challenge wasn’t “building pages.” It was making sure the data could move across multiple layers, without turning into garbage halfway through.
We connected PLCs, SCADA systems, and a few older DCS controllers into SAP MII. Data came from different vendors, different generations, different naming conventions, and different assumptions about time and structure.
We also pulled quality results from lab systems so operators didn’t have to wait for phone calls, paper logs, or someone walking over with a clipboard.
Then we built dashboards so plant managers and supervisors could see what was happening across sugar production, ethanol distillation, and cogeneration on one screen.
This was not “analytics” in the modern sense. It was operational visibility. Fast feedback. Trustable numbers. And in a seasonal operation running flat out, that is business value.
What We Actually Tracked (And Why It Mattered)
Because everything flowed continuously, the data model had to match reality.
You’re not counting parts. You’re measuring rates and conditions:
- flow rates
- temperatures
- pressures
- concentrations
- moisture
- efficiency
- yield
We built production tracking views that showed things like:
- sugar crystallization rates
- ethanol distillation efficiency
- tonnes per hour through the process
- bagasse moisture content (huge factor for energy generation)
The system also had to handle the agricultural variability. Each load of cane could have different characteristics, so the solution needed to capture input properties and connect them to efficiency and output calculations. The goal was to reflect reality, not an idealized production model.
When those numbers were right, managers could react faster:
- adjust process settings
- catch quality drift earlier
- reduce losses
- improve yield
- avoid hidden downtime
In a harvest season, that responsiveness is the difference between a good season and a painful one.
The Energy Piece Became a Game Changer
The energy monitoring side turned out to be one of the highest-value parts of the whole implementation. Because the plant generated its own power, it needed visibility into:
- steam production
- turbine efficiency
- power output
- energy balance across the operation
The cogeneration team needed very precise tracking because this was revenue and cost optimization happening in real time. We pulled that data into SAP MII and built reports showing the energy balance across the whole plant. That visibility helped answer questions like:
- How much energy is being produced vs consumed right now?
- How efficient is the turbine today vs yesterday?
- Is bagasse quality affecting steam generation?
- Are we optimizing for sugar output or power export?
What surprised me was how quickly leadership started using that data to drive decisions. It wasn’t “nice charts.” It was operational steering.
The Challenge Nobody Puts on the Slide
If you’ve worked in industrial integration long enough, you know this part always exists, but it rarely makes it into the project story. Not everything went smoothly.
We spent weeks debugging OPC connectivity issues because one vendor’s PLC used a slightly different data structure than the others. Small differences that sound trivial in a meeting become brutal when you’re trying to get stable live data.
The plant network infrastructure also wasn’t designed for real-time data collection. Latency showed up. Connection drops happened. Some links were unstable. And when your “real-time” system stops being real-time, trust evaporates fast.
So a lot of effort went into making the solution resilient enough to survive the real plant environment. This is one of those lessons that still applies today.
In modern IIoT projects, people love to focus on the cloud stack, the architecture, the platform, the pipeline. But if the connectivity layer is weak, none of that matters.
Data Trust Was Harder Than Integration
Here’s another honest part. Convincing shift supervisors and operators to trust the numbers took longer than building the solution. They were used to:
- walking the floor
- checking analog gauges
- relying on experience
- making judgment calls based on sound, smell, vibration, instinct
That world works, until you need consistency across shifts, across weeks, across sites. But switching behaviors is not automatic.
Even when the data is “correct,” people don’t trust it instantly. Trust is earned through repetition, consistency, and seeing that the system matches reality when it matters.
So a big chunk of success came down to training. A lot of training. Not because they weren’t smart. Because they were smart enough to be skeptical.
What Worked (And Why It Worked)
A few things made the solution stick.
1) One place to see the truth
Having production and energy on the same operational view was powerful. Instead of chasing separate logs and separate systems, the story came together in one place.
2) Real-time quality visibility
Pulling lab results into the same environment meant fewer delays and fewer blind decisions. Operators could adjust faster, especially when quality parameters drifted.
3) Web-based access mattered
The simplicity of delivering everything in a browser was not a small detail. Plant engineers, shift supervisors, operations managers. They could all access the same information without heavyweight installations.
4) The numbers actually meant something
It wasn’t just data being collected “because integration is good.” It was data tied to yield, energy, uptime, and revenue. That’s why people cared.
What I Learned (That Still Maps to IIoT Today)
This project taught me lessons that I now see repeating in almost every modern IIoT initiative.
Industry knowledge is not optional
I had to learn how sugar mills really work.
- what “pol” means
- why bagasse moisture matters
- how the harvest cycle changes the plant’s priorities
- where the real bottlenecks hide
You can’t build a good system without understanding the process. Not the PowerPoint version. The real one.
Continuous manufacturing forces a different data mindset
In discrete manufacturing, you track units. In process manufacturing, you track behavior over time.
You measure flows and conditions. You aggregate differently. You interpret trends instead of just counting events. That impacts everything from tag design to KPI definitions.
“Single version of the truth” is not always the goal
Here’s an unpopular opinion from the field. Sometimes the “single version of the truth” everyone talks about is overrated. Yes, integrating shop floor and ERP data is valuable.
But people on the floor don’t care about financial postings. They care about:
- tonnes per hour
- process stability
- quality drift
- equipment running or not
- whether they’re losing the harvest window
So the system has to be designed for the user, not for the architecture diagram. Integration only creates value when the result matches what operators need to do their job.
Seasonal operations make reliability everything
During harvest, every downtime minute hurts. So reliability and support planning matter more than fancy features. When systems fail at the wrong time, everything else becomes noise.
Sustainability and efficiency reporting showed up early
Even back then, sustainability reporting mattered. The plant wasn’t just producing sugar and ethanol. It had to prove it was operating efficiently and minimizing waste. Having data on:
- energy consumption
- water usage
- emissions indicators
made reporting easier and more credible.
Today this would be called ESG reporting, sustainability analytics, operational performance management. Back then it was just “we need to show what’s really happening.”
If I Did This Today, It Would Be Easier (And Cleaner)
Looking back, this kind of project would be significantly easier today. Not because the plant got simpler, it didn’t. Because the modern IIoT toolbox is better.
Today you’d likely implement this with:
- more standardized connectivity patterns
- MQTT for publish/subscribe data movement
- a Unified Namespace for consistent structure and naming
- cloud pipelines for storage and scalable analytics
- easier ways to manage identity, access, and governance
- better tooling for data quality monitoring and observability
You’d also have more proven patterns for:
- tag naming conventions
- asset models
- site-to-site scaling
- edge-to-cloud buffering
- event-driven integration
Back then, a lot of that had to be figured out the hard way, in the plant, under pressure. And honestly, that’s why those projects were such good teachers.
Looking Back
That project in 2008 and 2009 taught me that manufacturing is endlessly diverse, but the core challenge stays the same. You’re connecting OT to IT so the plant can run smarter.
Sugar and ethanol was seasonal, agricultural, energy-intensive, quality-variable, and brutally time-sensitive. A world apart from automotive assembly or pharma batch manufacturing. And that’s what made it interesting.
Today we might label it “IIoT transformation” and wrap it in modern architecture language. Back then, it was just solving real plant problems with the tools available. And the lessons still hold.
Leave a Comment